APRIL 18-21, 2017
|
News
Sponsors
Previous Events
Channels
Logo
You can download the logo here.
|
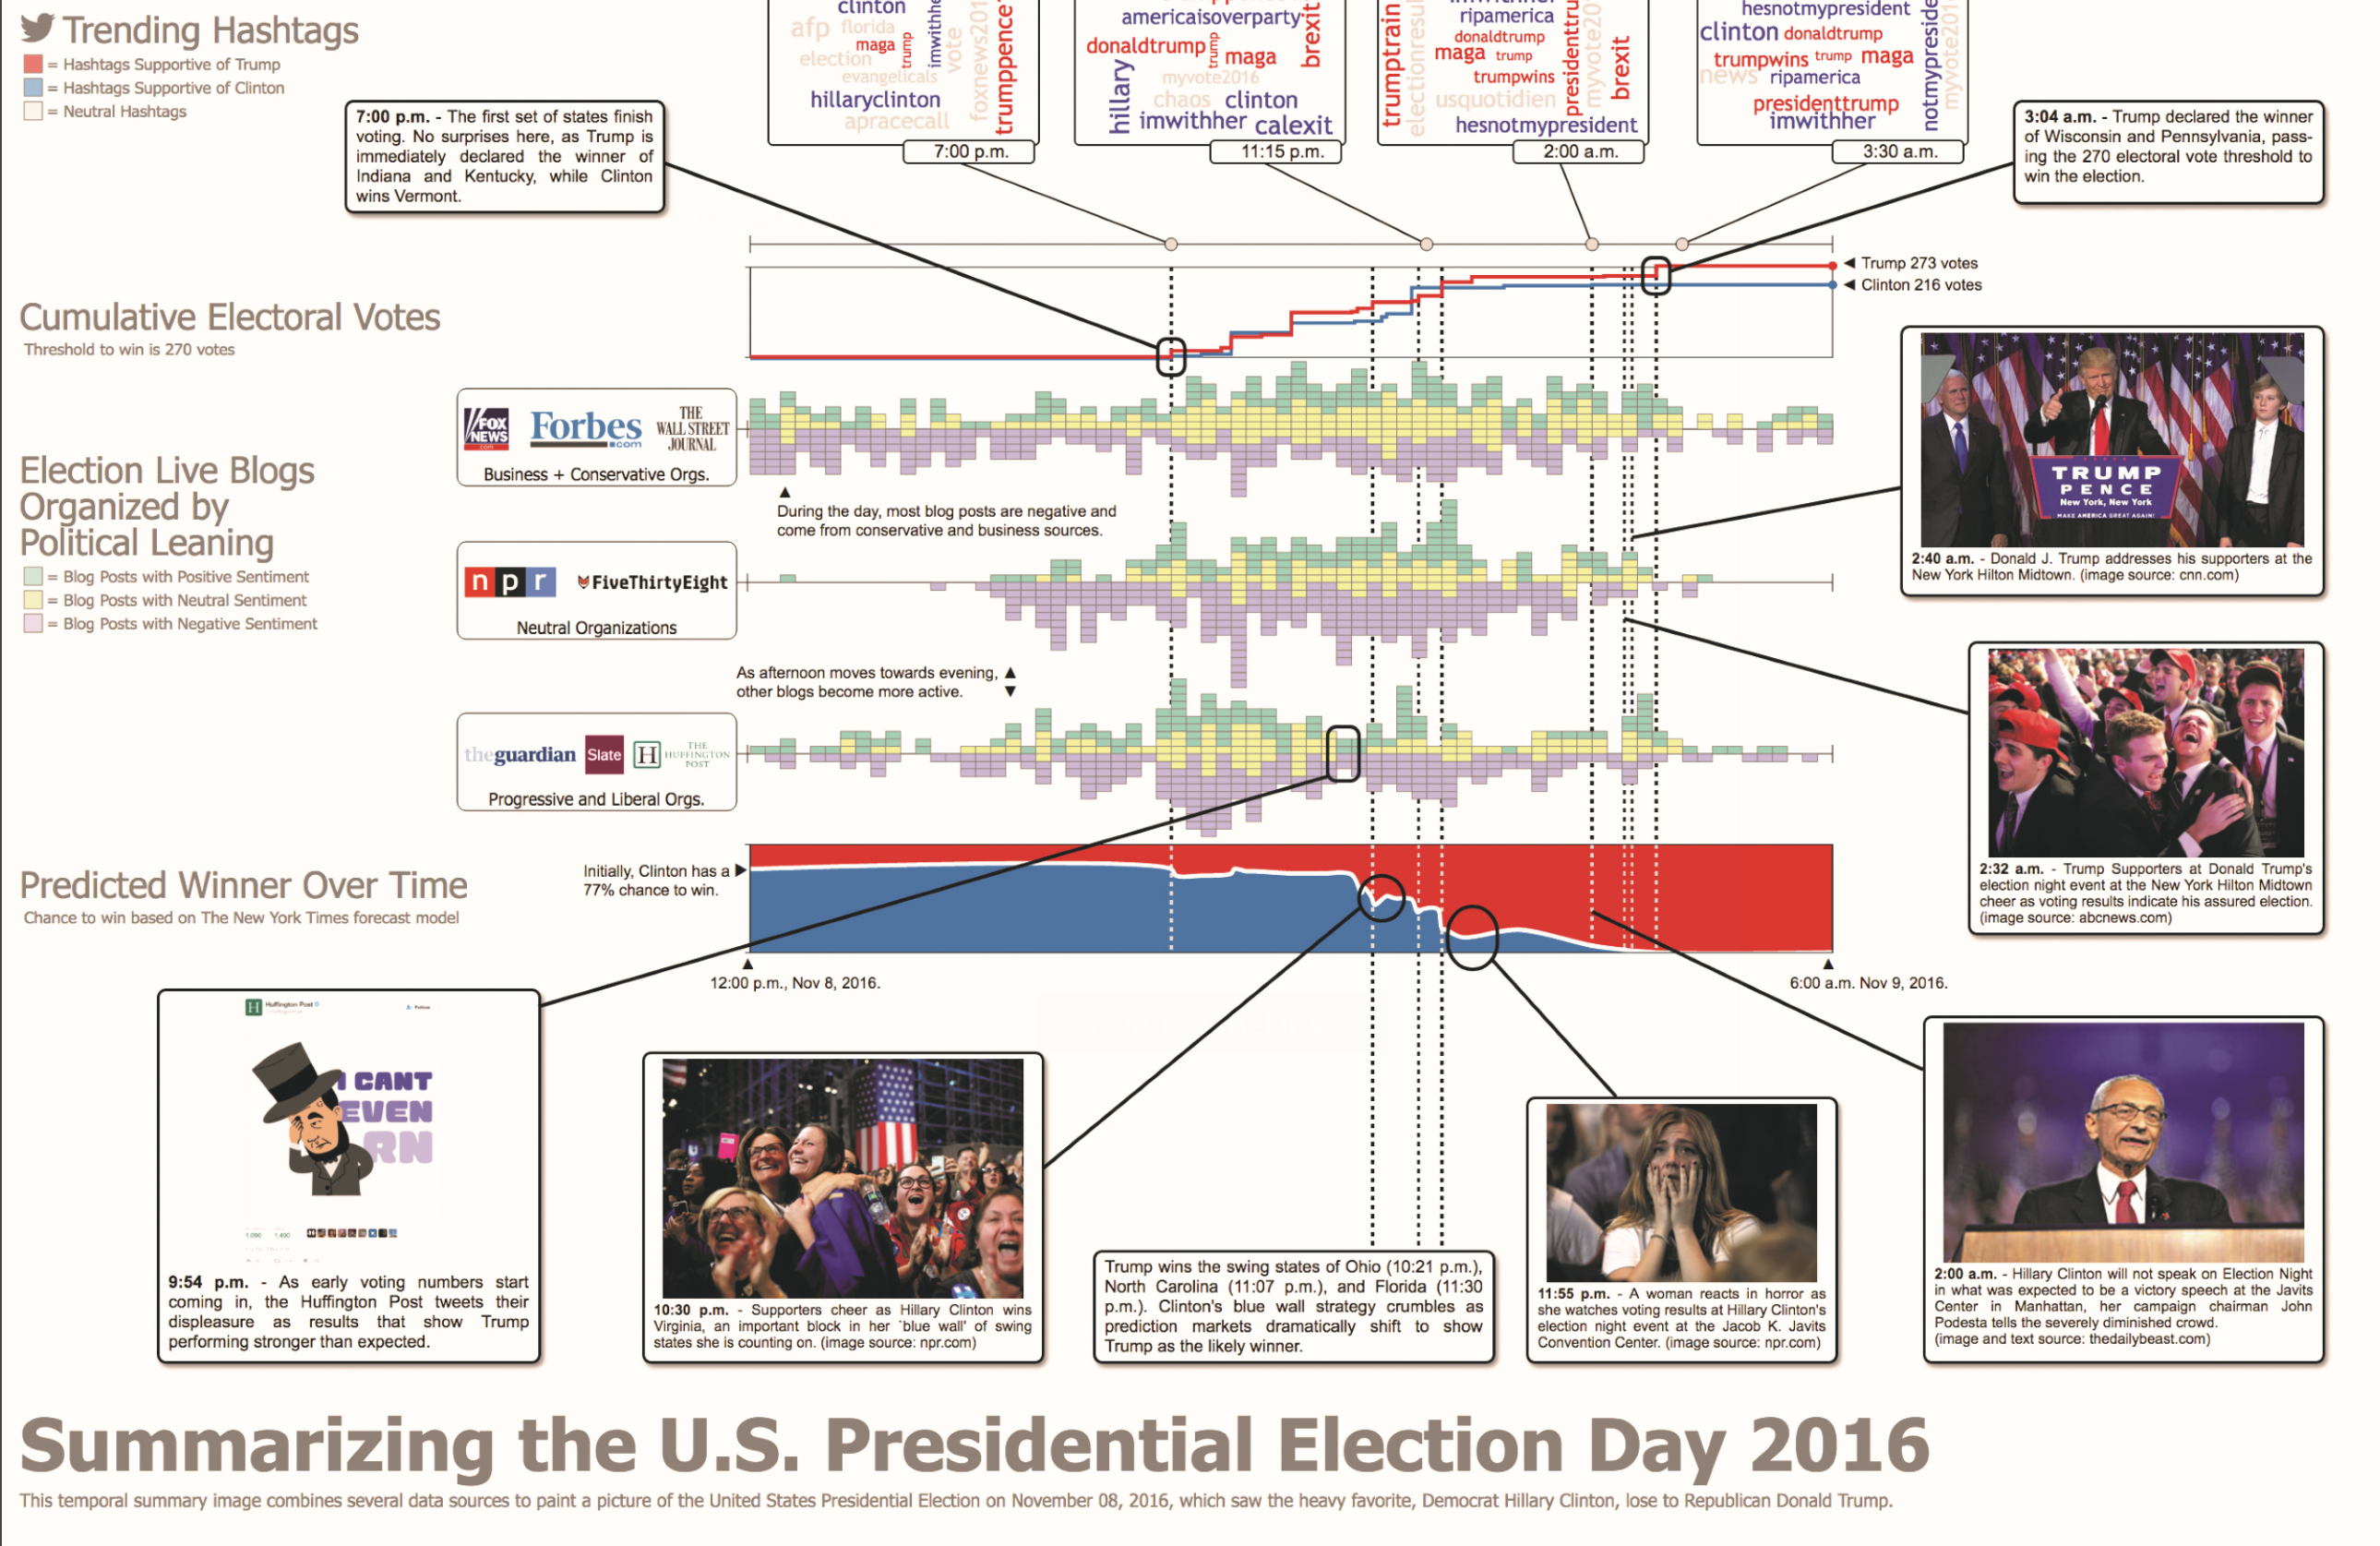
Summarizing the U.S. Presidential Election Day 2016
AbstractTemporal Summary Images (TSIs) were introduced at InfoVis 2016 as an approach for complex dataset summarization and narrative storytelling. We use this framework, which combines small multiples with linked time-dependent visualizations and overlaid annotations, to build a data-driven infographic of the U.S. presidential election day– November 08, 2016. The result uses several online data sources: hashtags extracted from over twelve million tweets, electoral college results, predicted winner forecasting, and blog posts scraped from the election live blogs of several news organizations. Blog sources are grouped by political bias and sentiment analysis has been applied to their posts. Annotations provide additional context about the data streams and highlight important temporal events throughout the night. By combining automatic data generation and layout with manual refinement and visual design, TSIs allowed for a streamlined design in producing presentation-quality graphics. |


